In the article about Logistics Network Modelling, we went through why and how to create a baseline. One of the most important points was to reflect as much as possible the current state of the network in order to improve it.

But first of all, what are you trying to optimize? The goal is usually to reduce the costs and/or improve the service level, but what levers can you activate? Do you want to modify your current footprint? Upgrade your fleet? Evaluate different transport modes? Review your inventory policies? All of the above?

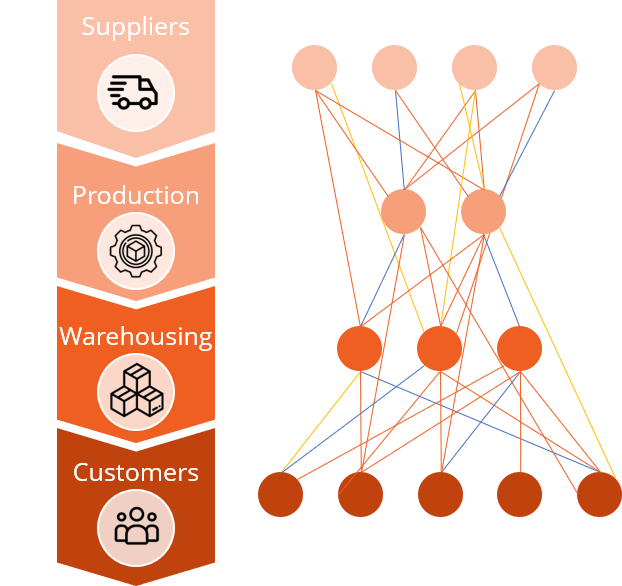
Network optimization can happen at various levels. The Supply Chain Guru software (presented in the previous article on network modelling) is a powerful tool to do so. It allows the user to work on 3 topics, simultaneously or separately: Network, Production, and Inventory.

Network Optimization

By network optimization, we understand the optimization of nodes and flows. This means we will be able to modify:

  • The size and location of warehouses or production facilities
  • Fleet capacity, transport modes and flow consolidation

At C2.0, optimal location of warehouses is usually the first step for every network optimization project. This step is known as “Greenfield” analysis.

Greenfield Analysis

A Greenfield analysis aims at defining the ideal location for your distribution centres, by identifying the centres of gravity of your network.

We start from scratch, excluding the current nodes. By keeping other parameters such as customer orders and transport modes, Supply Chain Guru computes the ideal location of your warehouses. We can therefore overlay the result of the Greenfield analysis with your current network and validate if the warehouses are located at the same places or not.

In other words, the Greenfield analysis allows us to compare your current network versus an ideal situation. To compute centres of gravity, Supply Chain Guru minimizes the weighted average distance to customers (i.e., minimizes transportation costs).

We can take it even further. It is possible to keep the actual number of warehouses and see what the ideal locations would be for new warehouses. Let’s take the following example :

Company XYZ has clients all across Canada (in blue), a manufacturing centre (in red) and three warehouses (in green). The manufacturing centre does not act as a distribution centre in this model.

Distribution sites and customers_Canada
Node locations
Mapping of flows

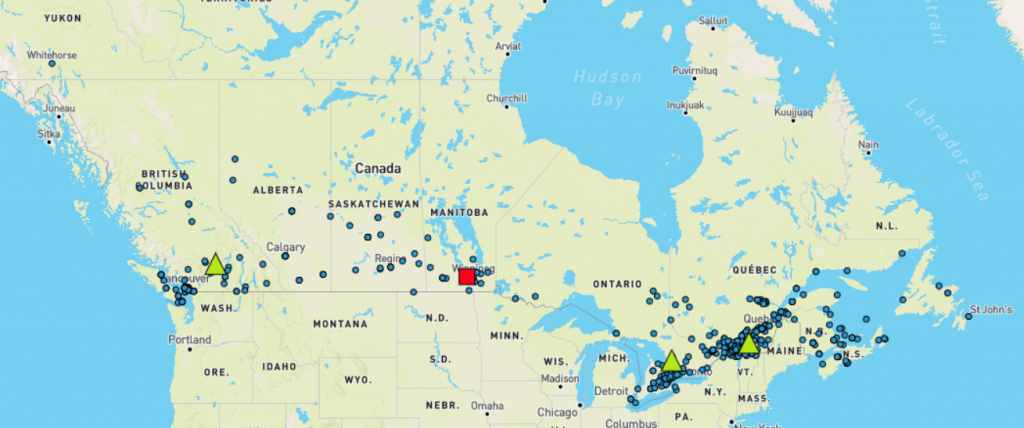
Let’s now assume that you decide to add two new distribution centres… You just need to specify that to Supply Chain Guru and run the Greenfield analysis. Supply Chain Guru will find the two ideal locations for your next warehouses, based on customer orders and existing locations (distances are calculated using the longitude and latitude).

Network footprint with two additional warehouses
New mapping of flows

Now that we have two new locations, what do we do with this information?

First of all, check that these two new locations make sense. Are the warehouses in an accessible area? Will there be enough qualified labour in the vicinity?

Once validated, you can add these two warehouses to your network, give them an inventory policy, maximum capacity, fixed and variable costs, etc. and run a new scenario to understand the full picture of your new network.

Warehouse location based on service level

We saw that with the Greenfield analysis we can minimize the weighted average distance between warehouses and customers.

Another approach would be to minimize the locations that would ensure a maximum service level within a certain range.

Let’s assume that a truck can go for 700 km in a day. You wish to find the ideal locations for your warehouse that maximizes the number of clients in a day.

This constraint can be modelled in Supply Chain Guru.

In this case, the weighted average distance is not optimized and will be higher than compared to a Greenfield analysis. However, you will ensure that your clients will benefit from a service level in accordance with your company standards.

Minimum weighted average distance due to a very high volume in south Florida. Clients upstate will not all be served within one day.
warehouse in a more central location
By locating the warehouse in a more central location (geographically), all clients will be served within a day

In the end, it is all about defining your key success factors to come to decide on the best solution. C2.0 is by your side during this step, as we understand it is as important as the modelling stage.

Flow optimization

Flow optimization is the second step when looking at improving your current network.

Here, we will consider that the nodes are defined in advance and cannot be modified. This is usually the case when one uses ports or airport infrastructure on which we usually have very limited control or simply when you cannot or do not to modify the current locations of your warehouses.

Starting from the baseline, we will consider several improvements to bring to the model. It can be done in various ways, including:

  • Deleting historical constraints
  • Considering new flows
  • Adding new transport modes

Deleting historical constraints

Historical constraints are defined in the baseline (see the article how to model your logistics network) to reflect reality.

A common situation is when you delete historical flows from warehouses to customers, either to let the system decide on the best flows to achieve or because a new warehouse, closer to customers, was recently made available.

For example, a distribution centre in Germany ships electronic devices to malls in Portugal. This company has been working like this for years but recently acquired a new facility in Spain.

With the baseline, the model can only use the flow Germany – Portugal. This flow will have to be deleted as you would like to let the model use the Germany – Spain and Spain – Portuguese corridors (using for instance FTL shipments from Germany to Spain and LTL shipments from Spain to Portugal).

Considering New Flows

In the optimization module, you can indicate that you want to create additional flows (which is also what we should do in the previous example). It is not about forcing the software to use a specific lane, but rather let him decide if it is beneficial to use one that was not available before.

If the lanes bring savings and meet the target, then they will be used. If not, then we will see quickly in the outputs that no volume goes through them.

New Flows Example

Let’s take the example of two subsidiaries of a company, one based in England and the other one in France. The two companies export goods to the American market, respectively from the ports of Southampton and Le Havre. We could look at the possibility of consolidating these two flows between the two ports. Are the rates, volumes and destinations different? Based on these elements, the software will propose its optimal solution. It is then up to us to validate if it is worth implementing it or not.

Production Optimization

Although Supply Chian Guru is not software dedicated to production, it can still model some parameters that you would like to consider.

Adding production aspect increases greatly the model complexity. Thus, the first is to determine whether you want to add it to your network model or not.

If your primary objective is the distribution of goods from your warehouses to your clients, then it not necessary to include production.

However, if warehouse selection and outbound flows depend on an optimized production between the different manufacturing centres, then yes, you should consider it.

How to know which manufacturing centre should produce which product based on:

  • Fixed and variable costs
  • Warehouse storage capacity
  • Customer orders

You must gather these data sets to model your production capacities. The level of detail to go into must be defined in advance. C2.0 acts as a partner to support you during this phase. Together, we look at your production and answer various questions such as

  • How many products should we consider?
  • At which product level, should we stop?
  • Which level of the Bill of Material is the correct one to model?
  • Should we model production work centres?
  • Which costs are fixed or variable?

The optimization will then depend on various factors on which you can influence. For example, increasing the number of shifts within the factory, work centre automation, etc. These factors are taken into account through various scenarios in Supply Chain Guru. The results of the analysis are expressed in terms of fixed and variable costs as well as capacity. It is up to us to compare these different scenarios and select the most profitable one.

Inventory optimization

Logistics network optimization can be achieved by modifying different parameters. A tool such as Supply Chain Guru allows you to act at various levels of granularity, from adding facilities and flows to truck speed, fuel surcharges, taxes or even greenhouse gas emissions.

In any case, each optimization scenario must be analyzed to understand the impacts in terms of costs for your company. Supply Chian Guru allows you to visualize the results at various levels in accordance with what has been modelled.

  • Total costs
  • Expected benefits
  • Transport, production, and inventory costs

But it is up to us, supply chain professionals, to analyze the results and pick the best scenario for our company.

To accomplish this, C2.0 acts as your partner and together we build the key success factors to define your future network. Discussions between all the stakeholders of the network are paramount for optimization projects, and it is through an efficient teamwork that we will meet your targets.

Conclusion

Logistics network optimization can be achieved by modifying different parameters. A tool such as Supply Chain Guru allows you to act at various levels of granularity, from adding facilities and flows to truck speed, fuel surcharges, taxes or even greenhouse gas emissions.

In any case, each optimization scenario must be analyzed to understand the impacts in terms of costs for your company. Supply Chian Guru allows you to visualize the results at various levels in accordance with what has been modelled.

  • Total costs
  • Expected benefits
  • Transport, production, and inventory costs

But it is up to us, supply chain professionals, to analyze the results and pick the best scenario for our company.

To accomplish this, C2.0 acts as your partner and together we build the key success factors to define your future network. Discussions between all the stakeholders of the network are paramount for optimization projects, and it is through an efficient teamwork that we will meet your targets.

C2.0 is an official partner of Coupa. Do not hesitate to reach out to us if you wish to learn more about Supply Chain Guru or for any project about network optimization, we will gladly accompany you in your upcoming challenges.

Have you ever looked at the possibility of reducing the costs of your logistics network? Did you ever ask yourself if it was optimal? Where the nodes of your network at the right location?

As they are not usually part of the company’s core business, logistics and distribution aspects are often put in the background and happen to be a major cost factor.

Reducing logistics costs is an important lever to improve a company’s competitiveness. Several options can be explored, such as inventory management, warehouse automation or, and this is what we will be focusing on in this article, network design optimization.

Companies can have dozens of warehouses, hundreds of clients and thousands of products. Which network is the best? How can we find the one that minimizes logistic costs? The human brain alone is not up to the task. Such problem requires the use of dedicated software, along with a clear understanding of what we are trying to achieve. In this article, Conseil 2.0 is demonstrating its methodology to tackle these questions.

Supply Chain Baseline_Supply Chain Guru de Llamasoft

Supply Chain Guru (SCG) is a tool that allows you to model your logistics network and to optimize it in order to find the best one for your company. The main features of SCG in regard to this are two-fold:

  1. Modelling of the actual network, or baseline
  2. Network optimization

Modelling the baseline: a crucial step for every network design project

The more project is close to completion, the more expensive modifications are. This also applies to our case. The baseline must be properly modelled before going any further. If not, future optimization results will not be useful.

The baseline: why and when to build it?

Why

There are three main reasons why you must build a baseline prior to any network optimization project. The goals of the baseline are

  • Validate that the model reflects the company’s data
    • Are the flows properly modelled?
    • Are the computed costs in accordance with company’s financial statements?
  • Act as starting point for future optimizations
  • Act as a reference point to compare with scenarios
    • How are my transport costs evolving? What about my warehouse costs?
    • What is the impact on my service level?

When

A baseline is a way to make sure we are heading in the right direction. It must be built:

  • After data collection and validation
  • Before building any optimization scenario

Data collection and validation is a step of paramount importance, though often neglected. We usually tend to think that our data is automatically available and ready to be used. However, as we will see further in the article, exporting ERP data, combining Excel files and uploading them in the software is usually not enough.

Depending on the network complexity, we estimate about 3 to 5 weeks to collect and analyze the data, then another 3 to 5 weeks to build the model. If anyone tries to shorten this time, it will most certainly have a negative impact during the optimization phase.

Timeline baseline_Supply Chain Guru Llamasoft

Data Collection

The data to collect can be divided into different categories (the quantity of data sets varies depending on the project complexity), but in most cases we need at least data on:

  1. Products (type, weight, volume, unit cost, etc.)
  2. Sites (customer locations, distribution centre locations, production site locations, site sizes, etc.)
  3. Financial aspects (distribution centre fixes and operating costs, transport costs, customer demand, etc.)
  4. Inventories (ABC classification, inventory level, safety stock, etc.)

Depending on the project complexity, we could add more data such as the transport modes, the availability of these modes per distribution centres, production capacities, etc.

For every project, C2.0 follows 4 fundamental steps to collect data:

1. Verify that all required data has been gathered

There is usually a massive amount of data to collect, and it is easy to forget parts of it. We track closely the data collection status.

2. Ensure Data Integrity

Before modelling the baseline, it is imperative to analyze the data just to check its quality level. For various reasons (different IT systems, specific needs in some locations, etc.), data coming from different sites will use different naming conventions and formats, show a lack of coherence, contain erroneous information and data could also be missing.

3. Data Cleaning

Depending on the data integrity analysis, we could decide to add data, remove some of it (be careful to anticipate the impact of doing so), or make assumptions to overcome missing bits (that must be documented).

Here are frequent issues we face when cleaning the data:

  • Duplication of data
  • Inconsistent naming
  • Different granularity level between several sets of data
  • Multiple sources of information and no single source of truth
  • Missing links between internal data, transactional data and invoices
  • Confusions between interwarehouse shipments and customer orders

4. Data validation with stakeholders

Stakeholders that will validate the project must be involved right from the start to avoid any surprises. Does the data make sense to them? Are they familiar with the figures? Do they agree with the assumptions that were made?

Baseline Steps_Supply Chain Guru LLamasoft

We cannot stress this enough. Data collection is as long as it is vital for the success of the project. Neglecting this phase would put the entire project in jeopardy.

Fill in the Constraints

SCG will find the optimal model. Therefore, we need to model constraints to reflect reality such as business decisions, specific suppliers flows, fleet limits, the number of hours a driver can drive per day, etc. Constraints can be based on (among others):

  • Min/max
  • Weight or volume capacities
  • Costs
  • Time periods

SCG uses constraint tables so that the user can fill them in.

Build the baseline

You need to start by creating a new database that gathers all data previously collected (from the REP, WMS, reports, invoices, etc.). This historical data (mainly customer orders, shipments, production, sourcing, product characteristics) allows us to create the 6 fundamental elements to model the baseline:

  • Products
  • Sites
  • Demand
  • Policies on
    • Transportation
    • Sourcing
    • Inventory

Sourcing and inventory policies can be left out if the goal is to model only outbound shipments from distribution centres to customers. Also, if production is key in your network, production policies can be modelled as well.

Model Validation

It is important to select the right KPIs, that must be done at the same time as data collection. You must verify that the modelled baseline complies with the reality of the company. For example, we know that warehouse XYZ ships 97,000 lb of merchandise for the entire period of the exercise. The model indicates that it ships 98,000.

  • Is this gap acceptable?
  • What is our tolerance threshold?
  • How much does this gap represent versus the throughput of other warehouses? Can it be neglected?
  • What is the required effort to improve the baseline?

The model will never be 100% accurate. The question we need to answer is when can we consider the model good enough? This question is specific to each project and must answer case by case.

During the model validation phase, C2.0 works closely with the client to ensure that both parties are satisfied with the results so we can safely validate the first big milestone of the project.

The road to optimization

Now that we built the baseline and that it has been validated by the stakeholders, we look at optimizing the baseline and run scenarios such as adding or removing a warehouse, set up a cross-dock facility, consolidate flows, etc.

If the baseline is properly modelled, creating the scenarios is not the hardest part. The teams can therefore spend more time analyzing the results and maximize their time spend on tasks with added value.

C2.0 is an official partner of Coupa. Do not hesitate to reach out to us if you wish to learn more about Supply Chain Guru or for any project about network optimization, we will gladly accompany you in your upcoming challenges.

Have you ever wondered about the relevance of a software such as a TMS (Transport Management System) in your company? Indeed, these various software allow you to optimize your delivery routes and thus minimize driving time or distance traveled while taking into account your physical and time constraints. Here are 6 questions to answer to determine if you need a TMS.

1. Are you currently able to identify the impacts of adding express orders to your daily deliveries?

What may seem like a minor impact may be a “domino effect” on all your remaining deliveries for the day. It is possible to see an overview of these impacts in some TMS solutions and make a more informed decision about adding express orders to daily deliveries. This type of observation is very important to take into consideration when building routes. Indeed, it is sometimes more beneficial for a company to ship the express order the next day, rather than forcing a shipment into one of your ready-to-go trucks.

Verizon Preview Optimized route
Credit : Verizon Connect

2. Are you currently able to track your vehicles?

TMS software solution offer the possibility to track the route of vehicles. In case of a problem, this tool allows you to easily detect the location of your truck. Finally, you can even study the routes taken by your drivers to determine if they really took the shortest routes for their travel.

Real Time Dispatch & Tracking

Real time dispatch and tracking descartes preview
Credit : Descartes System Group

Detailed route progress review

Detailed route progress review descartes
Credit : Descartes System Group

3. Are your trucks currently running at full capacity?

Sending trucks at 75% or even 50% of their capacity is a considerable loss for your company. In fact, it is preferable, as much as possible, to use as few trucks as possible to make your shipments. This allows for a much better return on vehicle costs, as well as indirect gains by reducing the number of employees required for the task. In the case where the volume of demand is lower, we recommend assigning drivers to related tasks and making deliveries only when demand is higher.

C2.0 can do a preliminary study to identify the average capacity of your trucks when they leave for your customers. This allows you to evaluate your efficiency in terms of deliveries and to determine the threshold in order to identify the potential gains in productivity if the ratio is increased.

4. How do you currently build your delivery routes

It is interesting to have a team dedicated to the current road creation process. However, this workload converted into hours can be enormous and is not always the most optimal way to build delivery routes. We recommend that you compare your operating time costs versus the acquisition of a TMS, as you may be surprised at the return on investment of such a purchase. Furthermore, there are accessible solutions on the market that meet the needs of all sizes of businesses.

Manual Planning & Optimized Planning Preview Descartes
Crédit : Descartes System Group

5. What is the average delivery cost per order?

The average delivery cost per order is an important performance indicator for your distribution department. Indeed, a low average cost means that your trucks and routes are optimized. This allows you to gain a better profit margin on sales and to be more aggressive in the market by offering lower prices.

Thanks to the preliminary study discussed in the previous point, it is also possible to determine your current average delivery cost. This metric is based on your operating costs and the capacity used by your trucks. Once these values are defined, it is easy to estimate the potential gains from an optimization of your trucks.

6. What is the satisfaction rate of your customers (internal and external) with your deliveries

The TMS software solution is not really a tool to manage customer satisfaction, but there are modules, specific to certain solutions, which can considerably improve customer satisfaction. Indeed, this module allows to have an automatic communication to the customers. It is therefore possible for the software to send a text message or an email (based on the GPS information of the truck) announcing the arrival of the goods. In addition, if something unexpected happens on the road and the truck is likely to arrive outside the time slots planned for the customer, it is possible to notify the customer automatically.

Key takeaways

Here are three important things to keep in mind if you are considering implementing a TMS system in your company.

At C2.0, we have helped several companies structure their transportation and distribution operations. We are there to support the client at all levels of the TMS integration process. From the identification of solutions relevant to their needs, to the integration of the system into the company. Our expertise extends to several solutions such as:

Do not hesitate to contact us to discuss your needs!

C2.0 solidifies its partnership with Coupa to penetrate the Quebec market

C2.0, a supply chain advisory firm, is proud to officially announce today the signing of a System Integrator (SI) partner agreement with Coupa Software, regarding their supply chain digitization offer, more specifically their Procure-toPay (P2P) platform for the Quebec market.

C2.0 is familiar with Coupa and has been collaborating with them for the past six years. In fact, several of the firm’s consultants are certified and can assist clients with the integration of the platform.

« We are proud of this partner who is a leader in his field according to Gartner. Coupa integrates perfectly with the company's philosophy and their platforms and provides an efficient system for the supply and transport of customers. »

Daniel Vendette, Président Conseil 2.0

C2.0 is a supply chain advisory firm specializing in procurement, transportation and related systems. The firm has several experienced consultants specializing in several areas of the supply chain.

What’s more, this new integrator agreement between Conseil 2.0 and Coupa allows Coupa to broaden its visibility among Quebec companies and to promote its added value. Indeed, Coupa allows companies around the world to have the visibility and control they need to manage all their business expenses in one place. This solution is possible thanks to their Procure-to-Pay (fully Cloud) platform.

« We are excited to welcome Conseil 2.0 into the Coupa Partner Program, and together work to deliver real customer value to even more customers in Canada. »

Michelle Tapping - Vice-présidente régionale, Directrice de pays, Coupa Canada

To learn more about how Coupa can help you spend smarter, visit their website.

North America is known for its free trade. This is why when we face disruptions in levels such as political, economic, social, and many others, supply chains are heavily impacted.

Of course, when these events take place, as a business, it is difficult to escape these disruptions. However, it is possible to limit the consequences, and be well prepared. Here are a few tips to follow to ensure a smooth continuation of your supply chain.

1. Monitor variations related to the cost of raw materials

There are different methods and technological tools that offer predictive solutions. These work based on the company’s procurement history or using modern technological concepts, to assess risks regarding raw material costs. These methods or tools allow you to have more visibility on the range of variations of this parameter and subsequently help make decisions very early in the procurement process to manage this variability.

2. Avoid sourcing products from single-source suppliers.

Sourcing your products or raw materials from a single supplier is very risky, as you may encounter inventory problems if they run out of stock. This will cause production or customer satisfaction difficulties, and thus have consequences on your entire supply chain. Therefore it is important to buy from several suppliers. This allows you to have the necessary resources to meet your needs and those of your customers, and, to have access to a competitive market that will work in your favor.

There are intelligent sourcing platforms that allow buyers to find many similar suppliers for a product through machine learning and Artificial Intelligence (AI). This technology allows you to be aware of the different companies that can supply you and thus limit your risk. As a company, we use  Tealbook platform to help our customers not only access to this type of information, but also to consolidate and cleanse their supplier’s databases, i.e., remove duplicates and distinguish between parent and subsidiary companies.

3. Anticipate variations in delivery times

Variability in delivery times is a problem in any supply chain. This problem is due to various factors such as variations in customer demands, transportation delays, customs problems in case of international shipments, unforeseen events such as weather, etc. Therefore, as with cost variations, there are effective tools and systems available that can perform predictive analysis of delivery times, based on available data, and thus try to limit the impact of variability. In order to limit this disruption, you can also favor your procurement from nearby suppliers or also mitigate the risk of delivery delays by sharing it with suppliers. In other words, you can continuously share your production or demand forecasts with suppliers so that you don’t place orders at the last minute.

4. Establish quality controls

Implementing quality control practices and performing these controls frequently within a company allow eliminating non-compliant products. Therefore, making sure that you purchase from suppliers who perform these controls allows you to have compliant products according to your needs. Indeed, it happens that you need to get your supplies quickly and/or that you want to pay low prices for a certain need. If this is the case, you have to be careful with the different suppliers you deal with, because a lower price does not always mean that the products are of quality and in conformity.  So, take the time to properly qualify your suppliers to avoid potential problems and ensure the quality of your products.

5. Conduct a supplier's audit

Performing a supplier’s audit consists of an internal analysis of our suppliers, but also an external analysis of the different suppliers available on the market. Indeed, it is important to choose your supplier well, because it is an important actor in the supply chain of a company. Having a reliable supplier, allows you to have the right raw material, good products, to be delivered on time and with optimal costs. Therefore, when choosing a supplier, it is important to make sure that they offer good service and that they respect quality standards and contracts. There are several smart tools that provide information on suppliers’ qualifications, such as system quality management certificates, such as ISO 9000/9001, as well as information on corruption perception indices in their locations. As a result, buyers have the data they need to select their suppliers.

6. Sourcing from local sources

In order to anticipate the consequences of disruptions in its supply chain, it is important to source from local sources, such as local suppliers.  In this way, you minimize the risk of supply problems and ensure customer satisfaction.


7. Increase safety stocks

In the event of a disruption in the supply chain, your inventory will definitely be impacted. Indeed, you will have difficulty to supply yourself and ultimately you will be faced with a stock shortage. The solution to counter this disruption is to increase your safety stocks while following a good inventory management. Indeed, this method will allow you to have the right quantity of raw materials to produce and the right quantity of products for sale. In this way, you will be able to meet the needs of your customers and ensure their satisfaction.

When you follow a recipe, the dosage of the ingredients is essential. If you add too much salt, you alter the expected result. Inventory management is similar, in the sense that you must properly do your quantities of products to achieve optimal result in the management of your warehouses. Following the implementation of the ABC methodology, companies often take advantage of this opportunity to review their inventory volumes. The methodology for this is called “Min / Max”. This seeks to quantify the desirable number of products to keep in inventory, based in part on the categorization of the product made during ABC analysis. An approach such as the “Min / Max” allows companies to ensure the health of their warehouse(s). It tends to minimize the risk of backorders without keeping excessive quantities of products on your shelves.

Despite the importance of having good warehouse management, it is common for companies to leave this aspect aside. However, the inventory can represent up to 20-25% of the costs of the business. It is therefore essential for a company, who is seeking to be competitive, to put the emphasis on good inventory management.

The impacts of poor inventory management

Establishing a “Min / Max” methodology makes it possible to respond to common problems found in many companies. Below is a list of some potential issues that you could have if these quantities are not properly defined/applied

Over stock

• High storage costs
• Need for more space
• Increased risk of losing inventory or pending orders
• Obsolescence in your products (if applicable)
• Risk of workplace accidents

Under stock

• Inability to deliver customer orders and a long waiting period
• Lower customer satisfaction
• Better business opportunity for the competition
• Complexity of the receiving and shipping processes

In detail, the three realities that we come across are most often :

Storage cost / Space requirement

Keeping a high level of inventory represents a significant loss to your space and your finances. An unnecessary amount of product equals losses in warehousing costs on top of being sleeping assets for your business. In addition, the space unnecessarily occupied for these products could be used for other business needs. We have already seen space savings of up to 40% as a result of inventory management projects among our customers.

Poor management / Loss of inventory

Once the “Min / Max” are defined for all products, it is much easier to keep control within your 4 walls and thus reduce the risk of inventory loss. With the ABC tool, which makes it easier to define a location by class (The “A’s” should be near the loading docks for example), it becomes much easier to locate a desired product. With your minimum inventory, you should always have a volume on hand in the space assigned to your product, minimizing the risk of spillage in your warehouses.

Waiting period

Unlike the issues of excess inventory, those related to backorders can dramatically increase delivery times for customers. In addition to being unable to deliver the product on time, the warehouse falls into a reactive rather than a proactive phase. Under the influence of urgency, this change often triggers unreflective decisions that are not optimal for the business. We must therefore be careful of side effects, where the fear of running out of stock leads to the purchase of huge quantities of products. This decision changes the inventory balance and you run into excess inventory side.

How to determine its optimal quantity?

Now that you understand the importance of having a minimum and a maximum, here is how to roughly identify these values. The “Min” is based on the safety stock and the lead time of your product. Your “Max” is defined from the “Min” + the economic quantity to order (EOQ). This quantity represents the midpoint between the order cost curve and the storage cost curve.

Some of the parameters necessary for a good calculation of the EOQ are among others:

  • Annual demand
  •  Purchasing cost
  • Delivery cost
  • Storage cost
Graph demonstration about cost and quantity

Tools available to help you

There are several ways to calculate the “Min / Max” of a product, based on demand forecasts. It is possible that for some products demand follows a seasonality curve. Contrary to popular belief, your Min / Max doesn’t need to be static and can follow this curve as well. This flexibility allows you to be even more optimal in your approach. There are smart solutions to help you define these volumes according to your needs. In addition, it is essential to establish a good sales and operations planning (S&OP) strategy in your business. This allows demand to be aligned with supply capacity in the most cost-effective way possible and to control its history as well as sales forecasts.

Do not hesitate to contact us if you would like to learn more about the “Min / Max” methodology as well as the tools available to regain control of your warehouse(s).

Last week, all the media ofthe world were polarized on the American elections, but in the Supply Chain world the shocking news was the announcement of COUPA SOFTWARE acquiring LLamasoft (Supply Chain Guru, Optimiza, llama.ai, etc.). Conseil 2.0 is an official partner with these two companies and we are very proud to see these industry leaders join forces to offer connected solutions that meet multiple supply chain needs.

If the current year has shown us anything, it is the fact that for many companies the weaknesses in their supply chain’s structure can quickly make them collapse in the event of an unforeseen shock. This article aims to introduce you to the Supply Chain Guru (SCG) tools. This software offers modeling, optimization, and simulation solution that can help build a stronger foundation for the supply chain and help study the impact of shocks before they happen.

Modeling tool

The first opportunity that SCG offers is the possibility of modeling your network. You want to map your supply chain with products movements? You want to understand the breakdown of your different operating costs? The modeling tools allows you, with your internal data, to better understand your current business process. Like the proverb “a picture is worth a thousand words”, SCG offers several visuals to help you understand your data, and potentially identifies issues that will help taking decisions that are much more informed.

Optimization tool

The second opportunity that the SCG offers a “Machine Learning” module integrated directly into the software. Once the modeling of your network is created, it is possible to create a mirror image, and make the current model compete with the optimized one. It will help visualize the potential improvements of your network and its financial impact. The optimization of your supply chain will be based on metrics like product flow, service costs, production costs, transport cost, etc

Simulation tool

The third opportunity that SCG offers is a simulation tool. For any improvement project that you want to do in the supply chain, it is recommended to use the simulation before launching it. This step can help reveal issues that were not initially identified or even the infeasibility of the project. Like in the optimization tools, the SCG simulation tool create a mirror image of the initial model, on which it is possible to apply different constrain. For example:

  • Impact of demand increasing by X% in the current network
  • Closure / Opening of X distribution centers around the world
  • Increase / decrease in vehicle fleet

This solution can make your business save a tremendous amount of time and money if the project was initially poorly defined.

One of the strengths of SCG is that it is possible to use these 3 modules together. When using the software for Optimization or Simulation, it will be important to use the Modeling module to identify a “Baseline” as a comparison tool. This part of the work is crucial to the success of the project because all the studies will be made from this initial model. It is therefore important to put a lot of time and emphasis on validating the data that will be used as a baseline. Once this referent has been modeled and approved by the stakeholders, you only have to define the constraints to be simulated in the different scenarios, and run the software according to them.

One of the possible avenues of the simulation, which was not widely exploited before and which is expected to become more and more widespread, is the simulation of the impacts of natural disasters and climate changes on supply chains everywhere across the world.

• What happens if overnight we must close our borders?
• What are the impacts if we can no longer produce for 2 months?
• What is the impact if one of our raw materials becomes increasingly rare and its price rises exponentially?

With the SCG simulation tools, it is possible to evaluate these scenarios to be ready in the event of a possible outcome, like the one we are currently experiencing. This proactivity could pay off hugely for your business.

If you would like to learn more about the Supply Chain Guru software, please do not hesitate to contact us, we will be happy to help you. At Conseil 2.0 we offer several tailor-made services to meet your needs.

As an inventory planner/manager, you want to ensure that you maintain enough inventory in your warehouse to meet customer requirements (internal and external), but not have a surplus. That’s why inventory management is essential to track the flow of goods in and out of inventory. Each product is associated with various costs such as acquisition costs and/or warehousing fees, and the goal of the inventory planner is to reduce these costs by not running out of inventory.

Here is a reminder of what ABC analysis (inventory) is all about

ABC Analysis (Inventory)

ABC (activity-based costing), also known as ABC Analysis, ABC Classification, Pareto’s Law or 80/20 rule, is a method that classifies items or events into three classes (A, B and C) according to their degree of importance: A being the most important items and C the least important items. 

ABC (activity-based costing), also known as ABC Analysis, ABC Classification, Pareto’s Law or 80/20 rule, is a method that classifies items or events into three classes (A, B and C) according to their degree of importance.

Based on Pareto’s principle, which recommends that 20% of events occur 80% of the time, this method makes it possible to spread control efforts more evenly and to be more efficient. This method is mainly applied to inventory management. It allows us to classify items according to their value and thus establish an item control policy that gives more attention to the 20% of critical parts and less attention to the less important parts. There is a minimum of three product classes:

  • Class A: 20% of products; 80% of profits
  • Class B: 30% of products; 15% of profits
  • Class C: 50% of products; 5% of profits

This ranking tool can also be applied in companies at other levels, such as warehouse management and analysis of the causes of underperformance. This method is part of a production management approach. The expected results of the method, applied to inventory management, are better control of critical parts and a reduction in safety stocks.

The benefits of an ABC classification for your company

To help planners minimize their costs while optimizing their inventory, companies can benefit from using the ABC inventory analysis technique. Indeed, it allows them to optimize their inventory, improve their customer service levels and have a better management of the life cycle of their inventories. These improvements have a significant impact on the supply chain within the company.

Inventory Optimization

Inventory optimization is an important feature of ABC analysis because it allows inventory planners to organize high priority items based on actual customer needs. Based on demand fluctuations, inventory is adjusted to meet high demand for certain items but also to hold a limited inventory of slow-moving items.

Levels of service

Due to their level of demand, not all products can be treated in the same way or achieve the same levels of customer service. Depending on the product classification previously determined, service levels for different products will depend on several factors, such as the cost of the item, the quantity sold and the margin on the product. When talking about service levels, it is recommended not to keep large quantities of low-volume products because they are less sold and this causes clutter in the warehouse, as well as loss of revenue. Thus, ABC analysis allows planners to define the right service levels based on product classification, which improves overall supply chain performance while satisfying the real needs of your customers.

Graph demonstration about cost of service level

Ask yourself

Are you able to quantify the investment according to the level of service you establish?

Life cycle management

Each product goes through four phases during its lifecycle: launch, growth, maturity and decline. Once a product reaches maturity, it will decline sooner or later. Customer demand plays a key role in end-of-life management. With the ABC analysis concept, inventory planners can predict product demand in advance and manage inventory levels accordingly. With the right discipline, the ABC tool makes it much easier to identify mature and declining items. This allows for more proactive inventory management, allowing for level adjustments without accumulating a quantity of nonessential inventory, thus reducing the risk of obsolete items.

Digitization of the ABC methodology

The digitalization of supplies is a management approach that will have to be considered increasingly by companies. Indeed, in the near future, thanks to the addition of computer tools and business intelligence, it will be possible to adjust the ABC classification and Min/Max directly through digitization. It is by cross-referencing calculations of inventory levels, forecasts and actual sales that artificial intelligence will be able to cross-reference data and propose, or even adjust, the life cycle, stock levels and even generate replenishments directly.

As not everything is infallible, it will therefore be important for tomorrow’s managers to have a good knowledge of these metrics. A good configuration of the different systems will allow a better result, by selecting the right computer system for your company.

In 2020, high-performance IT systems are available to support you in your inventory management. In addition, they allow the optimization of your quantities needed to support your established customer service levels.

When are quantities optimal?

The exercise of a well-orchestrated ABC analysis allows companies to set up optimal quantities, per SKU, to be kept in inventory. This is referred to as “Min/Max”. Once you have established the ABC category, the desired level of service and the life cycle phase of your product, it is important to determine its optimal quantities.

At Conseil 2.0, we will help you in your ABC classification process. Feel free to leave a comment or contact us directly if you want to learn more.

When you decide to take your car, take your car, do you prefer to drive or let yourself be driven? The majority of you will prefer to drive and be in control. Why, when we talk about Logistics, leave the responsibility for transportation to our suppliers? Don’t we want to control our destiny and optimize our supply chain?

Part of the business community prefers to leave transportation to the supplier, a matter of responsibility. But in reality, at the end of the day, we are always responsible to our end customers. If our overseas supplier chooses its forwarder and a 45-day delivery time for our shipments of goods, then my service provider offers us a more economical alternative with a 30-day transit; Why not take advantage of it?

Taking control of logistics generates results with many benefits, such as service level agreements (SLA), general performance evaluation, visibility across the entire supply chain, financial benefits, not to mention the establishment of a partnership with your service provider. By determining the most appropriate incoterm for your purchases (Group E or F), you then have the responsibility to choose the carrier and, as a result, not only have full visibility on your supply chain but also only one service provider to manage.

Indeed, the selection of a carrier/transiter allows you to implement a service level agreement (SLA) and to monitor the evolution of the quality of service at predetermined intervals and according to key indicators of performance. In addition, your business is now of particular interest to the carrier: you are ready to entrust all of your transportation transactions to the carrier. Generating shipment progress reports, tracking orders including sending custom automated reports, and planning supplies with your suppliers based on ship departure days are just a few of the benefits of taking control of the transportation. In addition, the carrier will be happy to assign you an account manager who will take care of you during the trip you will make together.

It goes without saying that controlling its logistics also has positive financial consequences. When your supplier drives your ‘car’ (incoterms Group C and D), it does not do so for free. It is paid of course on the sale of its products, but also on the profit made on transport costs. There are no studies specifically devoted to this point, but according to information collected from various international carriers over the years, the percentage of profit would vary between 25 and 40. Do you really want to let your supplier take advantage of these gains?

Moreover, by mastering your logistics, you eliminate the intermediaries: no transport broker who hires a road carrier, no supplier who contracts a broker. You are now in direct contact with the carrier/transiter.

With more than 30 years of experience in this field, 2.0 Consulting is ready to assist you in taking control of your destiny.